
JUNE 2026 Market Stats
There were 1,699 home sales recorded via the Multiple Listing Service® (MLS®) System of the Cornerstone Association of REALTORS® (Cornerstone) in June 2026, representing a 0.8% increase month-over-month, and a 0.7% increase year-over-year.
“Following one of the slowest months on record in May, June showed signs of stability with sales activity ticking up 0.7 per cent year-over-year across our market areas. Several areas, including Burlington, Cambridge, Hamilton, Mississauga, and Norfolk County, posted stronger sales activity relative to the broader market,” said Bill Duce, CEO of Cornerstone. “On the pricing side, the Home Price Index (HPI) was down year-over-year in all areas, and down month-over-month across all areas, except Norfolk County, which registered a 2.1 per cent increase. Burlington was also the only city to report a year-over-year increase in average sale price. In many areas, the number of new listings was also down month-over-month and year-over-year, which impacts the inventory of homes for sale and the months’ supply. Overall, every city, town, and neighbourhood paints a different picture and offers buyers and sellers distinct opportunities, which is why working with a local REALTOR® who understands your community is more important than ever.”
There were 3,733 new listings added to Cornerstone’s MLS® System last month, a decline of 8.5% year-over-year and 2.0% from May 2026.
The total inventory across Cornerstone’s market areas increased 1.6% over the previous month and dropped 8.7% year-over-year. There was a 4.8-month supply at the end of June, representing a 2.0% decrease year-over-year. The number of months of inventory represents the time it would take to sell the current inventory at the current sales rate.
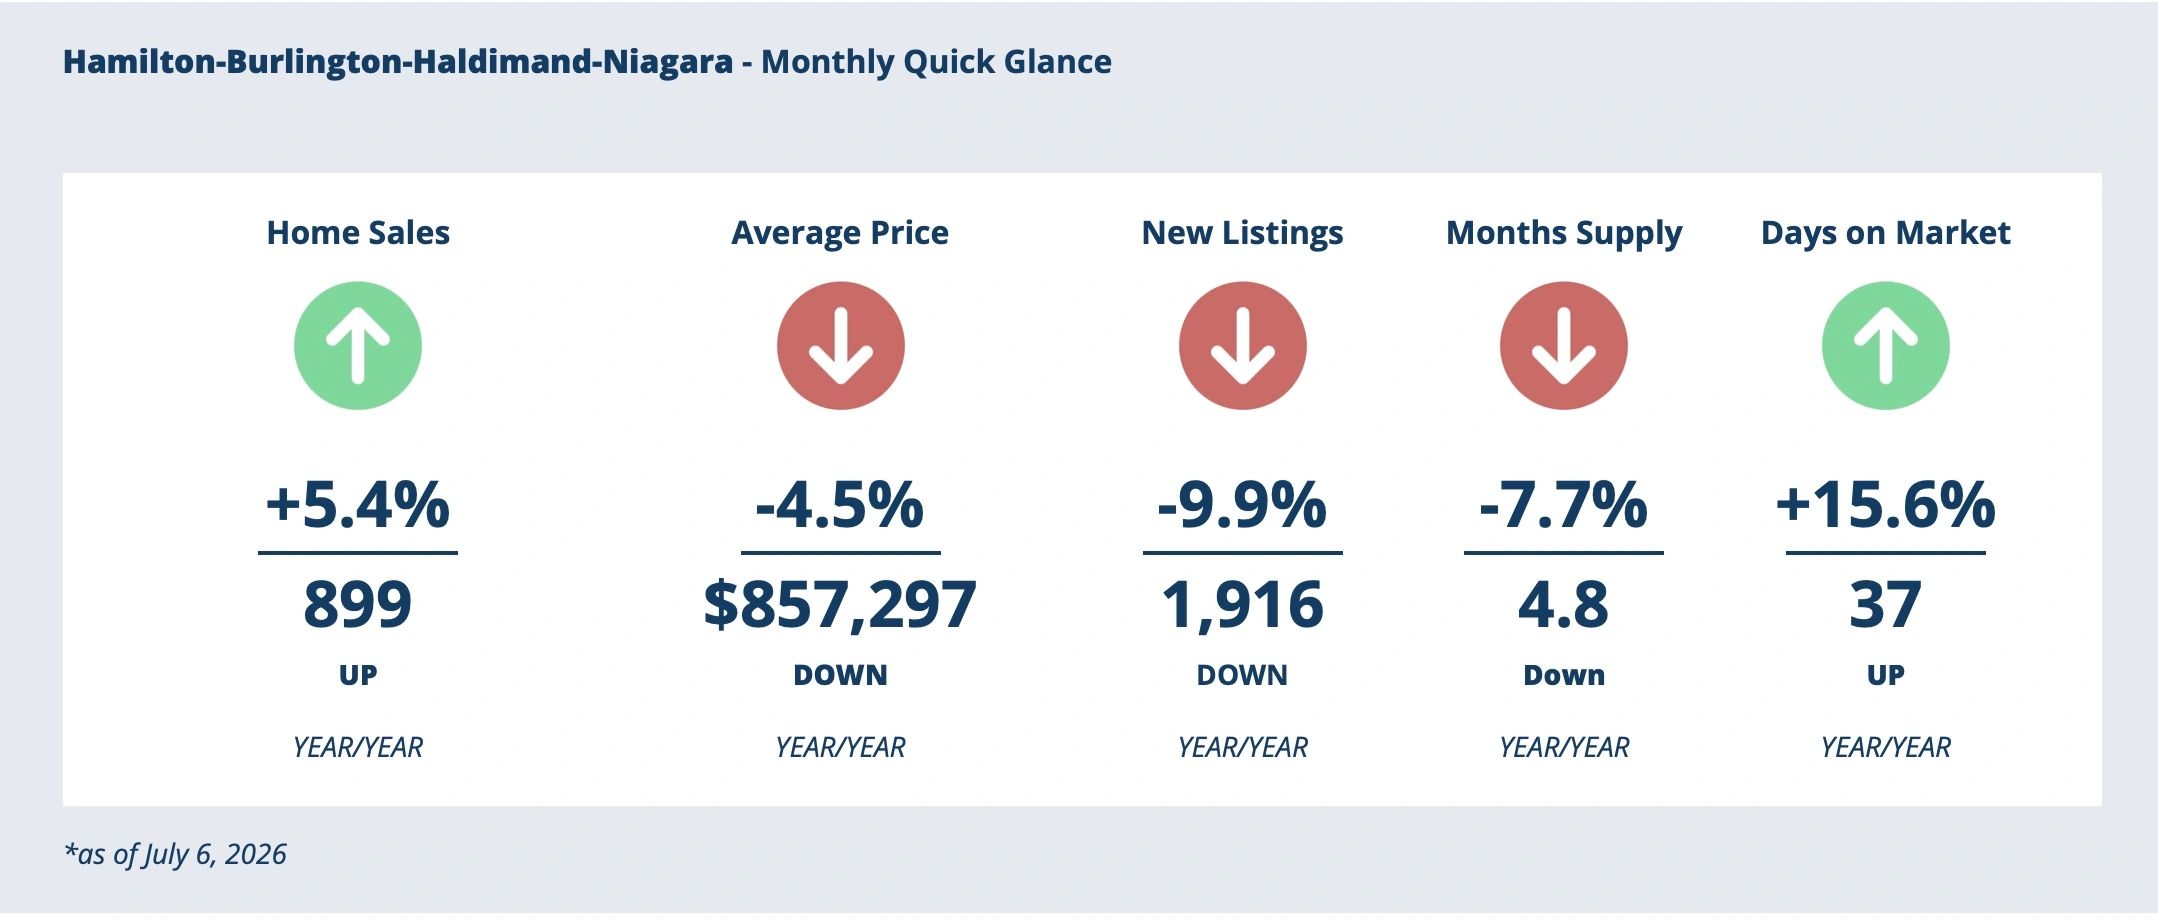
Hamilton-Burlington-Haldimand-Niagara North Area Highlights:
- Home sales decreased 1.7% month-over-month.
- The number of newly listed properties decreased by 3.6% on a month-over-month basis.
- The MLS® Home Price Index (HPI) was $737,400 in June 2026, a decrease of 0.9% compared to a month ago, and down 5.4% on a year-over-year basis.
- The inventory of homes for sale across the market area increased by 0.7% from the previous month and decreased by 11.7% year-over-year.
- By the end of June, the months’ supply was 4.8 months across all property types, unchanged from the previous month and 7.7% lower than in June 2025.
SEE THE FULL STATS RELEASE AND HISTORICAL STATS HERE: https://cornerstone.inc/hamilton-burlington-housing-stats/

Wondering what’s going on where you live?
I can provide virtual home evaluations and market information for your area - and as always its FREE!
This website uses cookies.
We use cookies to analyze website traffic and optimize your website experience. By accepting our use of cookies, your data will be aggregated with all other user data.